4.7
ORIENTATION IMAGES OF EXPERIMENTALLY DEFORMED ROCKS
top / contents / section 4 / pages -- 4.1 -- 4.2 -- 4.3 -- 4.4 -- 4.5 -- 4.6 -- 4.7
Dynamic recrystallization of quartzite along deformation gradient

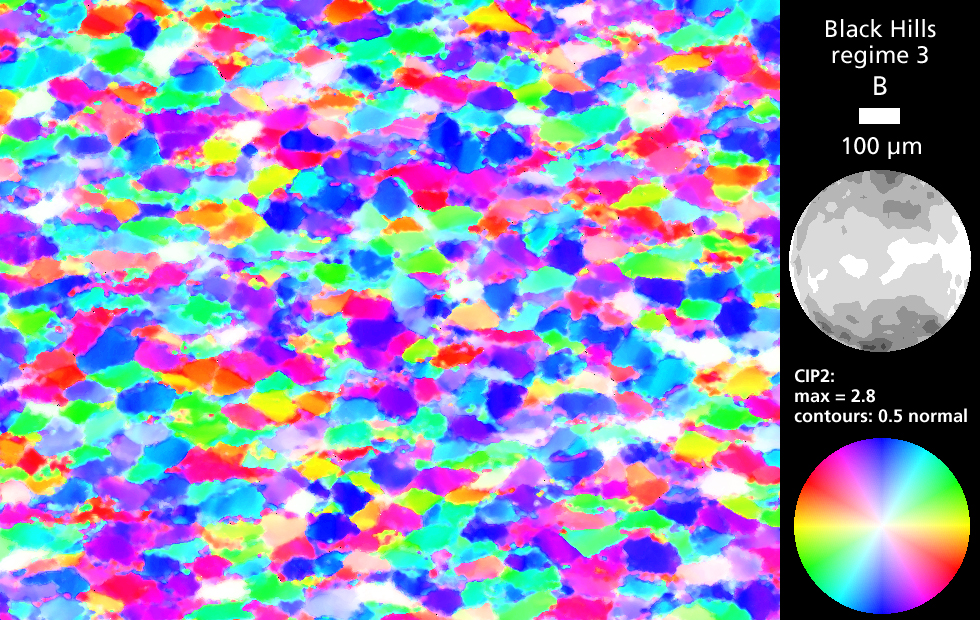
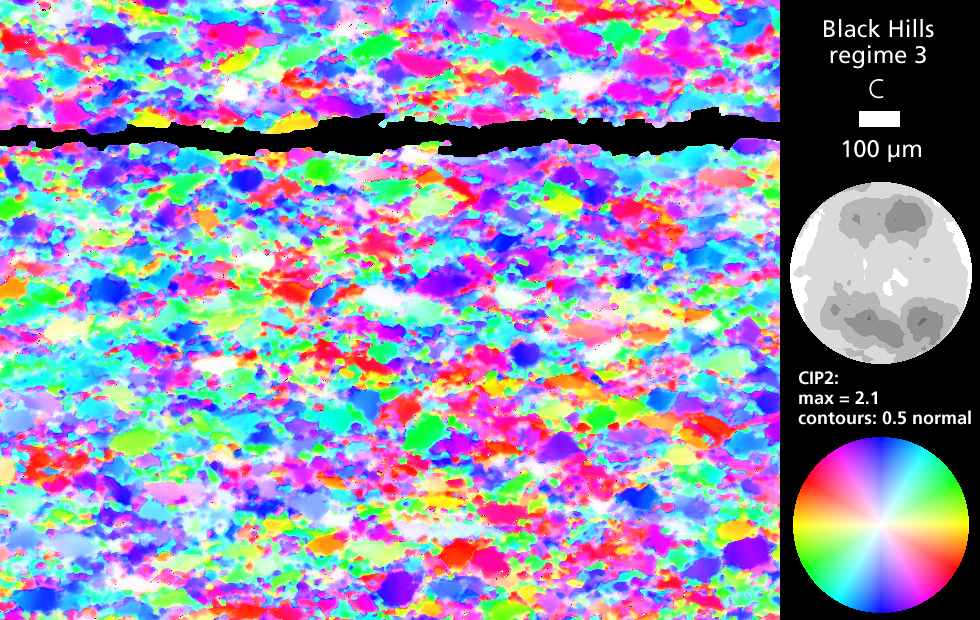
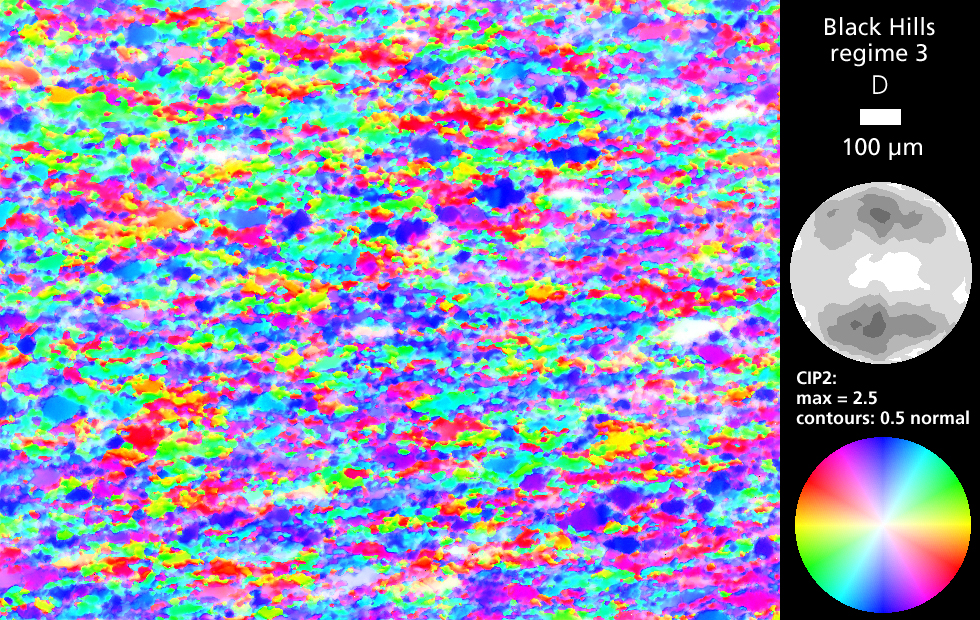
Experimentally deformed Black Hills quartzite. Deformation occurred in the transition region between regime 2 and regime 3 dislocation creep (Hirth & Tullis, 1992).
Experimental conditions:
- pc = 1.5 GPa
- T = 900°C
- strain rate = 10-6 s-1
- 0.16wt% water added
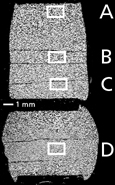
The total shortening of sample CQ78 (A.B.C) and sample CQ82(D) is 36% and 57% respectively. However, the deformation intensity increases from sample site A to C.
Note also, how the bulk c-axis pole figure changes, from near random (starting material) in A to a small circle distribution with discrete maxima in C and D (80-90% recrystallized).
Left, from top to bottom:
- CQ78, site A, B, C
- CQ82, site D
Below:
axial sections of sample CQ78 and CQ82, image sites indicated