contact Cover


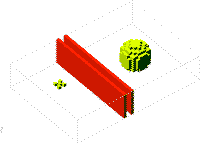
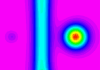
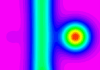
1.2 The effect on anomaly dimensions in magnetic data
This sequence of images show the effect on anomaly amplitude and width of progressively burying a 1 km diameter sphere, two 200 m wide dykes and five 200 m on a side cubes by increments of 200 m.

The first row of images have the same absolute range, so this sequence shows the effect of depth on amplitude.
The second row of images on have been clipped to the maximum and minimum values for each image, so this sequence shows the effect of depth on wavelength.

Click on the images to launch Noddy. A legend is provided at the end of this page.


3D view of geology, looking from SW.

View geology model

LOAD JPEG IMAGE


Pseudo colour magnetic images at various depths measured from top
Link
200 m

Open history with NoddyOpen FracViewer Movie
400 m

Open history with NoddyOpen FracViewer Movie
600 m

Open history with NoddyOpen FracViewer Movie
800 m

Open history with NoddyOpen FracViewer Movie
1000 m

Open history with NoddyOpen FracViewer Movie
Effect of depth on amplitude
Open magnetics with Noddy

LOAD JPEG IMAGE

Open magnetics with Noddy

LOAD JPEG IMAGE

Open magnetics with Noddy

LOAD JPEG IMAGE

Open magnetics with Noddy

LOAD JPEG IMAGE

Open magnetics with Noddy

LOAD JPEG IMAGE

Effect of depth on wavelength
Open magnetics with Noddy

LOAD JPEG IMAGE

Open magnetics with Noddy

LOAD JPEG IMAGE

Open magnetics with Noddy

LOAD JPEG IMAGE

Open magnetics with Noddy

LOAD JPEG IMAGE

Open magnetics with Noddy

LOAD JPEG IMAGE


Key
Survey Parameters
Scales
plugs & dykes
k = 10-2
background
k = 0
image width
10,000 m
inclination
-90°
intensity
70,000 gamma
flying height
200 m to 1000 m

2500


-200

max


min

All models created using
Noddy
Copyright © 1998-2002 AGCRC & Mark Jessell

WWW conversion by Ian Brayshaw